Calculating Imaging Data Latency
In this example we'll analyze the imaging data latency for a satellite constellation. Data latency is defined as the time between a satellite exiting an imaging region (Area of Interest) and the start of its next ground station contact for data downlink.
For this analysis we'll use the Capella constellation (a commercial SAR imaging constellation) and the KSAT ground station network. The Area of Interest is the continental United States.
This metric is critical for understanding how quickly collected imagery can be delivered to end users, which is a key performance indicator for Earth observation missions.
Setup
First, we'll import the necessary libraries and initialize Earth orientation parameters:
We download all active satellite TLEs from CelesTrak and filter for Capella satellites:
Next, we load the KSAT ground station network:
Define the Area of Interest
We define the AOI as a polygon covering the continental United States using a detailed GeoJSON outline:
Filter Ground Stations
We filter out ground stations that are inside the AOI. The reasoning is that a satellite cannot begin a downlink pass while it is still over the imaging region - it must first exit the AOI:
Compute AOI Exit Events
Using the AOIExitEvent detector with SGPPropagator, we detect every time a Capella satellite exits the US imaging region:
AOIExitEvent watches the sub-satellite point during propagation
AOIExitEvent (API) detects the instant a satellite's sub-satellite point - the geodetic longitude/latitude directly beneath the spacecraft - leaves a polygonal area of interest; AOIEntryEvent is the entry counterpart. The polygon comes from a PolygonLocation or, as here, raw (longitude, latitude) pairs via from_coordinates. Detection runs inside propagation: register the detector with add_event_detector, propagate, then read the timestamped hits back from the propagator's event_log(). Two things to watch: a detector instance is consumed when added, so each propagator needs its own (hence one per satellite in the loop above), and the test is on the nadir point rather than the sensor footprint - an off-nadir imager can still see an AOI after its ground track has crossed the boundary.
Compute Ground Contacts
We reset the propagators and use the access computation pipeline to find all ground station contacts over the 7-day period:
Calculate Latencies
For each AOI exit event, we find the next ground contact for that satellite and compute the latency (time difference):
Results
Top 5 Worst Latencies
The table below shows the 5 longest imaging data latencies - these represent the worst-case scenarios for data delivery:
| Satellite | AOI Exit (UTC) | Contact Start (UTC) | Station | Latency |
|---|---|---|---|---|
| CAPELLA-18 (ACADIA-8) | 2026-08-30 11:26:36 | 2026-08-30 12:21:01 | Bangalore | 54m 24s |
| CAPELLA-19 (ACADIA-9) | 2026-08-31 11:25:56 | 2026-08-31 12:20:20 | Bangalore | 54m 24s |
| CAPELLA-20 (ACADIA-10) | 2026-09-04 08:36:37 | 2026-09-04 09:30:35 | Bangalore | 53m 58s |
| CAPELLA-19 (ACADIA-9) | 2026-09-01 11:39:13 | 2026-09-01 12:28:34 | Mauritius | 49m 20s |
| CAPELLA-18 (ACADIA-8) | 2026-08-31 11:39:54 | 2026-08-31 12:29:15 | Mauritius | 49m 20s |
Latency Statistics
Summary statistics for all imaging data latencies over the 7-day period:
| Metric | Value |
|---|---|
| Worst (Maximum) | 54m 24s |
| Average | 13m 27s |
| Median | 5m 20s |
| Best (Minimum) | 1s |
| Total AOI Exits | 344 |
| Matched Latencies | 344 |
Visualization
The ground track plot below shows the satellite paths during the top 3 worst-case latency periods. The green dashed line indicates the US AOI boundary, and the blue circles show the ground station communication cones:
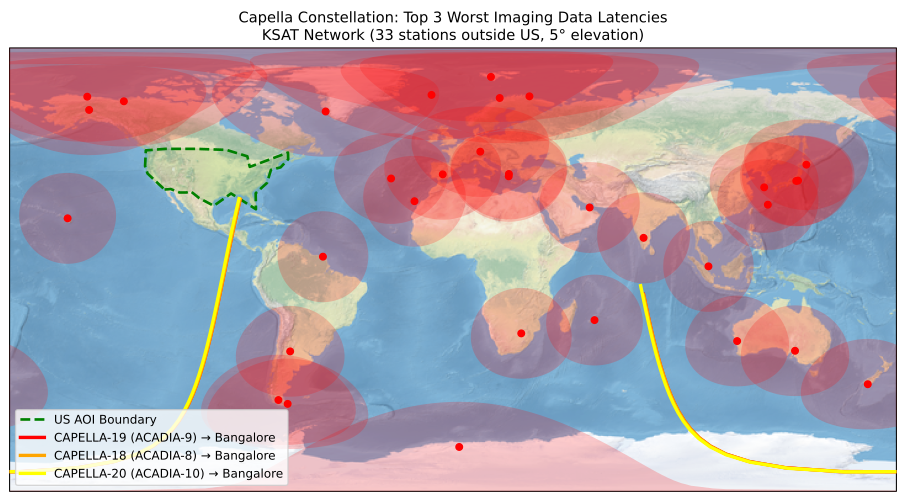
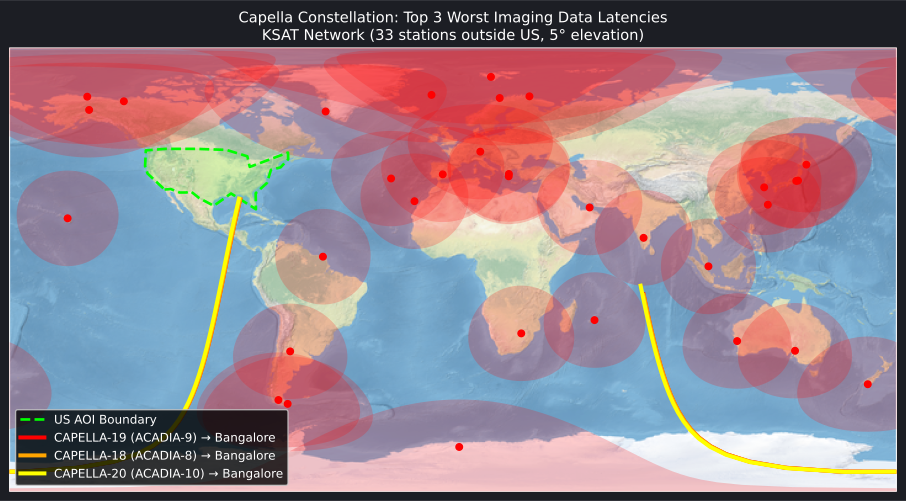
The colored tracks show the satellite ground paths from the moment of AOI exit until the start of the next ground contact:
- Red: Longest latency (worst case)
- Orange: Second longest latency
- Yellow: Third longest latency
This visualization helps identify geographic regions where additional ground stations might reduce data latency.
1 2 3 4 5 6 7 8 9 10 11 12 13 14 15 16 17 18 19 20 21 22 23 24 25 26 27 28 29 30 31 32 33 34 35 36 37 38 39 40 41 42 43 44 45 46 47 48 49 50 51 52 53 54 55 56 57 58 59 60 61 62 63 64 65 66 67 68 69 70 71 72 73 74 75 76 77 78 79 80 81 82 83 84 85 86 87 88 89 90 91 92 93 94 95 96 97 98 99 100 101 102 103 104 105 106 107 108 109 110 111 112 113 114 115 116 117 118 119 120 121 122 123 124 125 126 | |
Full Code Example
Full Code
| imaging_data_latency.py | |
|---|---|
1 2 3 4 5 6 7 8 9 10 11 12 13 14 15 16 17 18 19 20 21 22 23 24 25 26 27 28 29 30 31 32 33 34 35 36 37 38 39 40 41 42 43 44 45 46 47 48 49 50 51 52 53 54 55 56 57 58 59 60 61 62 63 64 65 66 67 68 69 70 71 72 73 74 75 76 77 78 79 80 81 82 83 84 85 86 87 88 89 90 91 92 93 94 95 96 97 98 99 100 101 102 103 104 105 106 107 108 109 110 111 112 113 114 115 116 117 118 119 120 121 122 123 124 125 126 127 128 129 130 131 132 133 134 135 136 137 138 139 140 141 142 143 144 145 146 147 148 149 150 151 152 153 154 155 156 157 158 159 160 161 162 163 164 165 166 167 168 169 170 171 172 173 174 175 176 177 178 179 180 181 182 183 184 185 186 187 188 189 190 191 192 193 194 195 196 197 198 199 200 201 202 203 204 205 206 207 208 209 210 211 212 213 214 215 216 217 218 219 220 221 222 223 224 225 226 227 228 229 230 231 232 233 234 235 236 237 238 239 240 241 242 243 244 245 246 247 248 249 250 251 252 253 254 255 256 257 258 259 260 261 262 263 264 265 266 267 268 269 270 271 272 273 274 275 276 277 278 279 280 281 282 283 284 285 286 287 288 289 290 291 292 293 294 295 296 297 298 299 300 301 302 303 304 305 306 307 308 309 310 311 312 313 314 315 316 317 318 319 320 321 322 323 324 325 326 327 328 329 330 331 332 333 334 335 336 337 338 339 340 341 342 343 344 345 346 347 348 349 350 351 352 353 354 355 356 357 358 359 360 361 362 363 364 365 366 367 368 369 370 371 372 373 374 375 376 377 378 379 380 381 382 383 384 385 386 387 388 389 390 391 392 393 | |
See Also
- Maximum Communications Gap - Related analysis of communication gaps
- Predicting Ground Contacts - Ground contact analysis example
- Access Computation - Understanding access windows and constraints
- AOI Events - AOIEntryEvent and AOIExitEvent API reference
- KSAT Ground Stations - Ground station dataset documentation