Maximum Communications Gap
In this example we'll analyze the communication gaps between a satellite constellation and supporting ground station network. For this work we'll use the Umbra constellation and 5 KSAT ground stations (Svalbard, Punta Arenas, Hartebeesthoek, Awarua, and Athens).
The maximum contact gap is a significant factor in the reactivity (speed from request to uplink) and latency (time from collection to delivery) for satellite imaging constellations.
Setup
First, we'll import the necessary libraries, initialize Earth orientation parameters, download the latest TLE data for all active spacecraft, and filter to select just the Umbra satellites:
We download all active satellite TLEs from CelesTrak as propagators and filter for satellites with "UMBRA" in their name:
Next, we load the 5 specific KSAT ground stations that will support communications:
Bundled ground station networks load without network access
datasets.groundstations.load (API) returns a named provider network - Atlas, AWS, KSAT, Leaf, NASA DSN, NASA NEN, SSC, or Viasat - as a list of PointLocation objects built from GeoJSON bundled with the library, so no download or account is involved and results are reproducible offline. The returned locations plug directly into access computation and plotting, and each carries its station name and metadata. It always returns the provider's full network, which is rarely what a mission actually has under contract - filter by get_name() as done here to model the five contracted KSAT stations rather than every KSAT site worldwide.
Constellation Visualization
Before getting further into the analysis, it's useful to visualize the 3D geometry of the constellation. We propagate each satellite for one orbit and plot their trajectories:
The resulting plot shows the complete Umbra constellation orbiting Earth:
Access Computation
To figure out the contact gaps, we first need to compute all ground contacts over the 7-day propagation window. We reset the propagators and compute access windows with a 5° minimum elevation constraint:
Max Gap Computation
Next we'll compute the contact gaps over the course of the simulation. The contact gap is defined as the time between the last contact for a spacecraft and the next contact for that spacecraft. The gap is always computed on a per-spacecraft basis:
The 10 longest contact gaps are shown below:
| Spacecraft | Gap Start (UTC) | Gap End (UTC) | Duration | Last Station | Next Station |
|---|---|---|---|---|---|
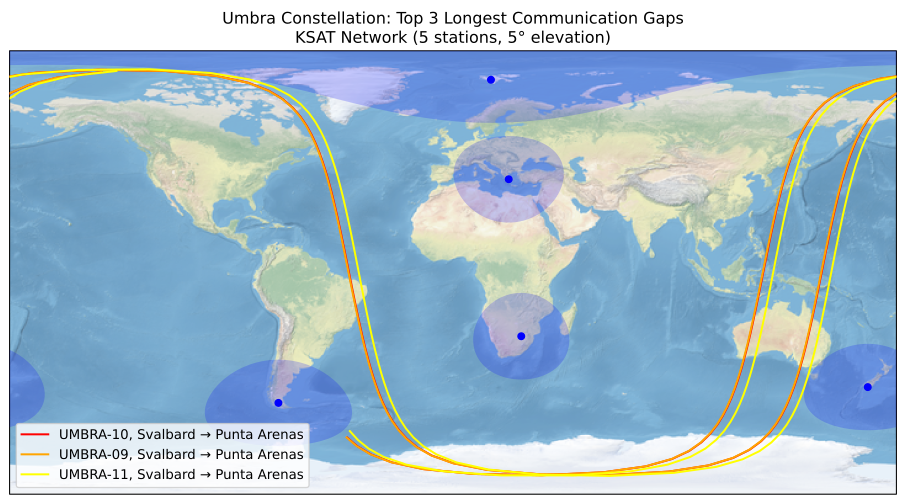
| UMBRA-10 | 2026-08-31 01:03:17 | 2026-08-31 03:31:43 | 2h 28m 26s | Svalbard | Punta Arenas |
| UMBRA-09 | 2026-08-31 01:03:54 | 2026-08-31 03:32:19 | 2h 28m 24s | Svalbard | Punta Arenas |
| UMBRA-10 | 2026-09-05 01:06:45 | 2026-09-05 03:35:07 | 2h 28m 21s | Svalbard | Punta Arenas |
| UMBRA-09 | 2026-09-05 01:07:22 | 2026-09-05 03:35:42 | 2h 28m 20s | Svalbard | Punta Arenas |
| UMBRA-11 | 2026-09-02 23:55:49 | 2026-09-03 02:23:59 | 2h 28m 9s | Svalbard | Punta Arenas |
| UMBRA-10 | 2026-09-04 01:24:55 | 2026-09-04 03:52:57 | 2h 28m 1s | Svalbard | Punta Arenas |
| UMBRA-09 | 2026-09-04 01:25:32 | 2026-09-04 03:53:32 | 2h 28m | Svalbard | Punta Arenas |
| UMBRA-10 | 2026-09-03 01:43:01 | 2026-09-03 04:10:52 | 2h 27m 50s | Svalbard | Punta Arenas |
| UMBRA-09 | 2026-09-03 01:43:38 | 2026-09-03 04:11:28 | 2h 27m 49s | Svalbard | Punta Arenas |
| UMBRA-11 | 2026-09-06 00:08:38 | 2026-09-06 02:36:26 | 2h 27m 47s | Svalbard | Punta Arenas |
The distribution of gaps for the constellation is shown in this histogram:
To better understand what percentage of gaps fall below a certain duration, we create a cumulative distribution plot. This shows the percentage of gaps that are less than or equal to each duration value:
The cumulative distribution plot includes reference lines at the 25th, 50th, 75th, and 90th percentiles, making it easy to determine what fraction of gaps are below a specific value.
Contact Gap Visualization
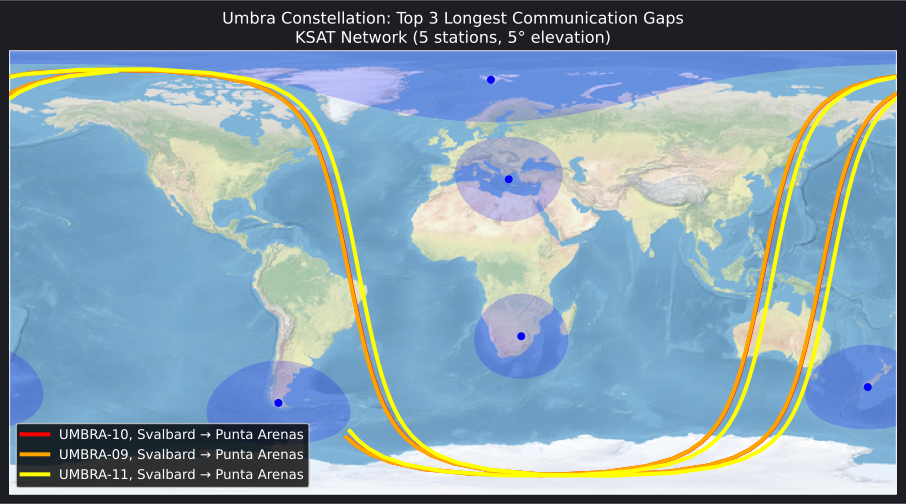
Finally, we'll visualize the 3 longest gaps on a ground track plot to see where they occur. For each gap, we extract the satellite's ground track during that time period and plot it as a colored segment. We also interpolate to the ±180° edges to avoid visual gaps at the antimeridian. This type of visualization can be helpful in understanding ground network design and where additional ground stations might help:
1 2 3 4 5 6 7 8 9 10 11 12 13 14 15 16 17 18 19 20 21 22 23 24 25 26 27 28 29 30 31 32 33 34 35 36 37 38 39 40 41 42 43 44 45 46 47 48 49 50 51 52 53 54 55 56 57 58 59 60 61 62 63 64 65 66 67 68 69 70 71 72 73 74 75 76 77 78 79 80 81 82 83 84 85 86 87 88 89 90 91 92 93 94 95 96 97 98 99 100 101 102 103 104 105 106 107 108 109 110 111 112 113 114 115 116 117 118 119 120 121 122 123 124 125 126 127 128 129 130 131 132 133 134 135 136 137 138 139 140 141 142 143 144 145 146 147 148 149 150 151 152 153 154 155 156 157 158 159 160 161 | |
Full Code Example
Full Code
| max_communications_gap.py | |
|---|---|
1 2 3 4 5 6 7 8 9 10 11 12 13 14 15 16 17 18 19 20 21 22 23 24 25 26 27 28 29 30 31 32 33 34 35 36 37 38 39 40 41 42 43 44 45 46 47 48 49 50 51 52 53 54 55 56 57 58 59 60 61 62 63 64 65 66 67 68 69 70 71 72 73 74 75 76 77 78 79 80 81 82 83 84 85 86 87 88 89 90 91 92 93 94 95 96 97 98 99 100 101 102 103 104 105 106 107 108 109 110 111 112 113 114 115 116 117 118 119 120 121 122 123 124 125 126 127 128 129 130 131 132 133 134 135 136 137 138 139 140 141 142 143 144 145 146 147 148 149 150 151 152 153 154 155 156 157 158 159 160 161 162 163 164 165 166 167 168 169 170 171 172 173 174 175 176 177 178 179 180 181 182 183 184 185 186 187 188 189 190 191 192 193 194 195 196 197 198 199 200 201 202 203 204 205 206 207 208 209 210 211 212 213 214 215 216 217 218 219 220 221 222 223 224 225 226 227 228 229 230 231 232 233 234 235 236 237 238 239 240 241 242 243 244 245 246 247 248 249 250 251 252 253 254 255 256 257 258 259 260 261 262 263 264 265 266 267 268 269 270 271 272 273 274 275 276 277 278 279 280 281 282 283 284 285 286 287 288 289 290 291 292 293 294 295 296 297 298 299 300 301 302 303 304 305 306 307 308 309 310 311 312 313 314 315 316 317 318 319 320 321 322 323 324 325 326 327 328 329 330 331 332 333 334 335 336 337 338 339 340 341 342 343 344 345 346 347 348 349 350 351 352 353 354 355 356 357 358 359 360 361 362 363 364 365 366 367 368 369 370 371 372 373 374 375 376 377 378 379 380 381 382 383 384 385 386 387 388 389 390 391 392 393 394 395 396 397 398 399 400 401 402 403 404 405 406 407 408 409 410 411 412 413 414 415 416 417 418 419 420 421 422 423 424 425 426 427 428 429 430 431 432 433 434 435 436 437 438 439 440 441 442 443 444 445 446 447 448 449 450 451 452 453 454 455 456 457 458 459 460 461 462 463 464 465 466 467 468 469 470 471 472 473 474 475 476 477 478 479 480 481 482 483 484 485 486 487 488 489 490 491 492 | |
See Also
- Access Computation - Understanding access windows and constraints
- KSAT Ground Stations - Ground station dataset documentation
- CelesTrak Dataset - Downloading TLE data
- String Formatting - Formatting time durations
- Predicting Ground Contacts - Related ground contact analysis example